Semantic Segmentation vTool#
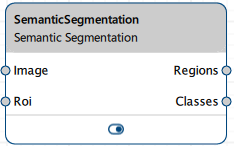
The Semantic Segmentation vTool can classify objects in images it receives via the Image input pin. It outputs the results via the Regions and Classes output pins.
If you also want to distinguish separate instances of the same class from each other, use the Instance Segmentation vTool.
If you use the ROI Creator vTool to specify a region of interest before segmentation, the Semantic Segmentation vTool accepts the ROI data via its Roi input pin. In that case, segmentation is only performed on the region of interest. As a side effect, this results in faster processing.
To buy a license for the Semantic Segmentation vTool, visit the Basler website.
How It Works#
Assume you want to identify and segment people in an image, distinguishing them from the background.
This is your input image showing three people in a warehouse environment with various equipment in the background:

You configure the vTool by loading a model that has been trained to segment images into two classes: person and background
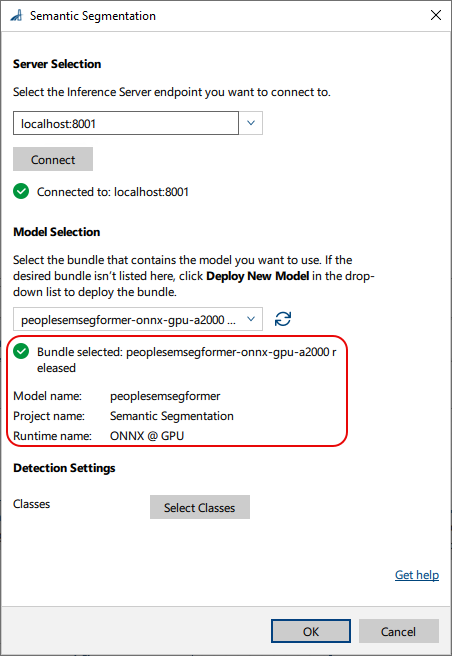
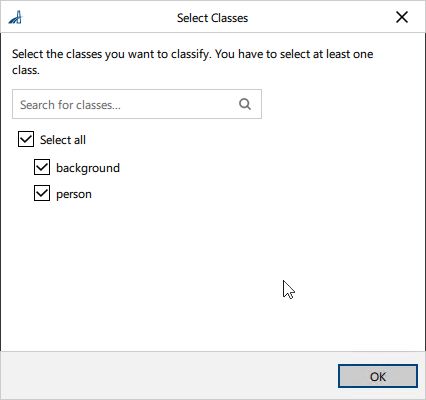
Next, you can select the classes you want to detect and segment. Some models may be tailored exactly for your use case. In that case, all desired classes are already selected.
After configuring the vTool, you run the recipe that initiates the inference process. The vTool utilizes the model to analyze the image and segment the objects present. When the analysis has finished, the segmentation result is returned, i.e., the regions and classes.
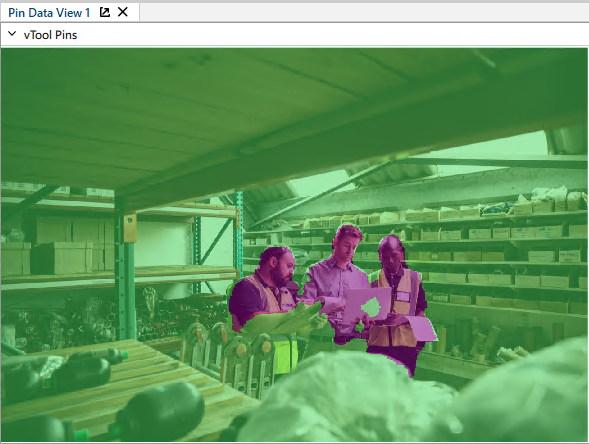
This is the resulting image in the pin data view showing only the segmented areas without the original image visible underneath.
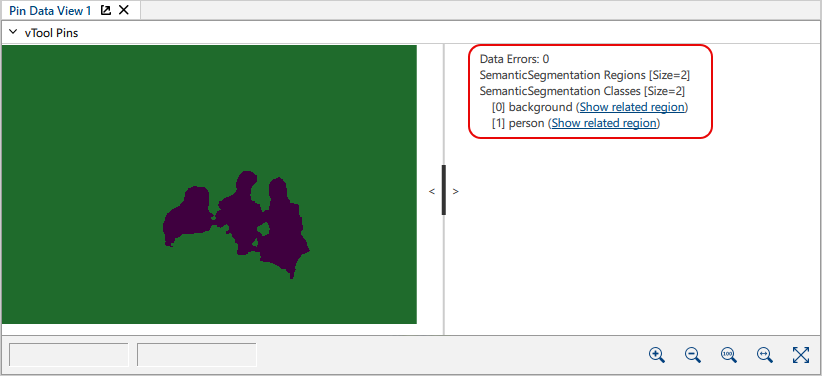
If you enable the input image in the pin data view, the segmented regions are overlaid over the original image. This allows you to see both the original image and the detected regions simultaneously.
Detailed Output
Regions: The vTool highlighted the regions where the model has detected people in the image. In the output image, the people are clearly segmented from the background, typically shown in distinct colors (in this case purple for people, green for background).
Classes: background, person
Configuring the vTool#
To configure the Semantic Segmentation vTool:
- In the Recipe Management pane in the vTool Settings area, click Open Settings or double-click the vTool.
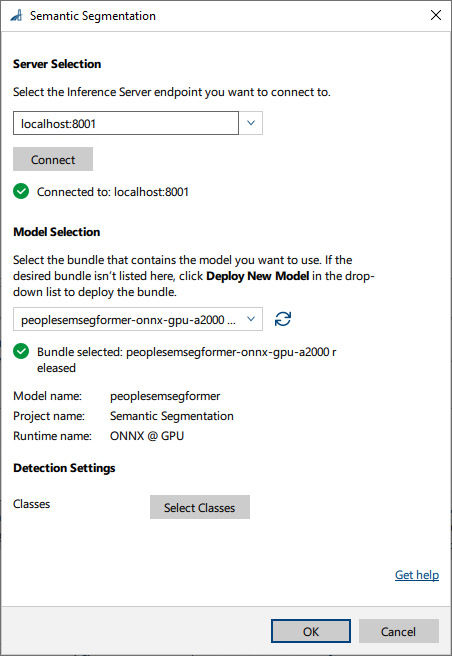
The Semantic Segmentation dialog opens. - In the Server Selection area, select the server you want to connect to.
The server must be running to be able to connect to it.- Option 1: Enter the IP address and port of your Triton Inference Server manually.
- Option 2: Select the IP address / host name and port of your server in the drop-down list.
- Click Connect to establish a connection.
The vTool then loads the available models. - In the Model Selection area, select the bundle that contains the desired model in the drop-down list.
After you have selected a bundle, the information below the drop-down list is populated with the bundle details allowing you to check that you have selected the correct bundle.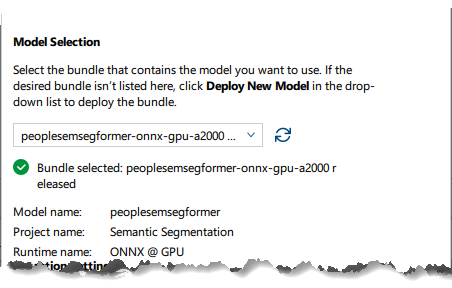
- If the desired bundle isn't listed, click Deploy New Model in the drop-down list.
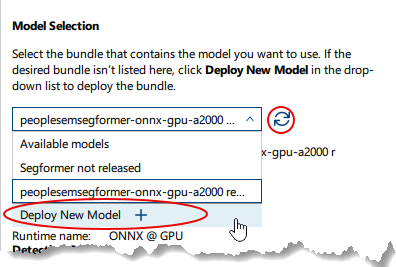
This opens the pylon AI Agent that allows you to deploy more models.
After you have deployed a new model, you have to click the Refresh button. -
In the Detection Settings area, click Select Classes to select the classes you want to classify.
A dialog with the available classes opens. By default, all classes are selected. You can select as many classes as you like.Info
The parameters available in this area depend on the model selected. Some parameters are only available after selecting a certain model. Default values are provided by the model.
-
Click OK.
You can view the result of the segmentation in a pin data view. Here, you can select which outputs to display.
Inputs#
Image#
Accepts images directly from a Camera vTool or from a vTool that outputs images, e.g., the Image Format Converter vTool.
- Data type: Image
- Image format: 8-bit to 16-bit color images
Roi#
Accepts a region of interest from the ROI Creator vTool or any other vTool that outputs rectangles. If multiple rectangles are input, the first one is used as a single region of interest.
- Data type: RectangleF, RectangleF Array
Outputs#
Regions#
Returns a region for each class label.
- Data type: Region Array
Classes#
Returns the predicted class labels.
- Data type: String Array
Payload#
Returns additional information regarding the performance of the Inference Server for evaluation. This output pin only becomes available if you enable it in the Features - All pane in the Debug Settings parameter group.
- Data type: String