Histogram#
Overview#
To open or close the Histogram pane, click the histogram button on the toolbar:

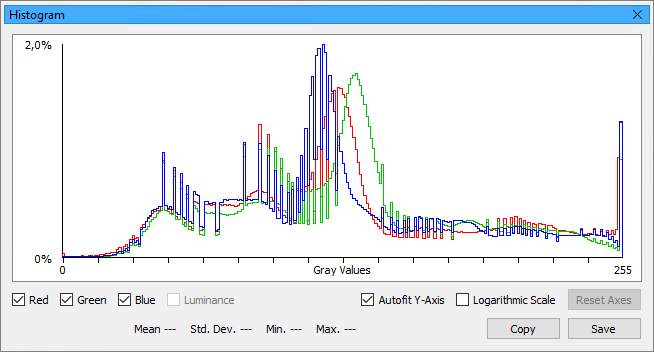
The graph shows you the number of pixels per gray value.
The X-axis represents the gray values, ranging from 0 to the maximum gray value. The maximum gray value depends on the pixel format selected.
The Y-axis represents the number of pixels (in percent of all pixels in the image) with that particular gray value.
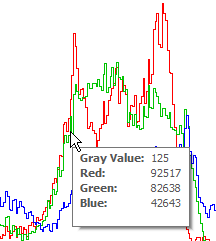
To get more information about the distribution of gray values, move the mouse pointer over the graph:

In the example above, the tooltip shows that in the current image, there are 92517 red pixels, 82638 green pixels, and 42643 blue pixels with gray value 125.
Displaying Data#
- Red / Green / Blue: Shows or hides the individual histograms for red, green, and blue pixels. Only available if the camera's pixel format is set to a color pixel format. When a histogram is hidden, its values are excluded when copying or saving data.
- Luminance: Shows or hides the luminance histogram. Only available if the camera's pixel format is set to a mono pixel format. When a histogram is hidden, its values are excluded when copying or saving data.
- Autofit Y-Axis: When enabled, the Y-axis continuously adapts to the maximum value of the graph. Enabling this option is useful to get a complete view of the histograms and removing any unnecessary white space. Disabling this option is useful if you want to monitor changes to the histograms under different conditions.
- Logarithmic Scale: Switches between a linear and a logarithmic view of the data.
- Reset Axes: Resets the zoom level. Only available if you have zoomed into the graph.
- Mean / Std. Dev. / Min. / Max.: If you select only one histogram (red, green, blue, or luminance), statistical data about that histogram is displayed here. If you select multiple histograms, no data is displayed.
Exporting Data#
-
Copy: Copies the data of all histograms displayed to the clipboard. This allows you to transfer the data to other applications, e.g., MS Excel:

-
Save: Saves the data of all histograms displayed in a .csv file.
Panning and Zooming#
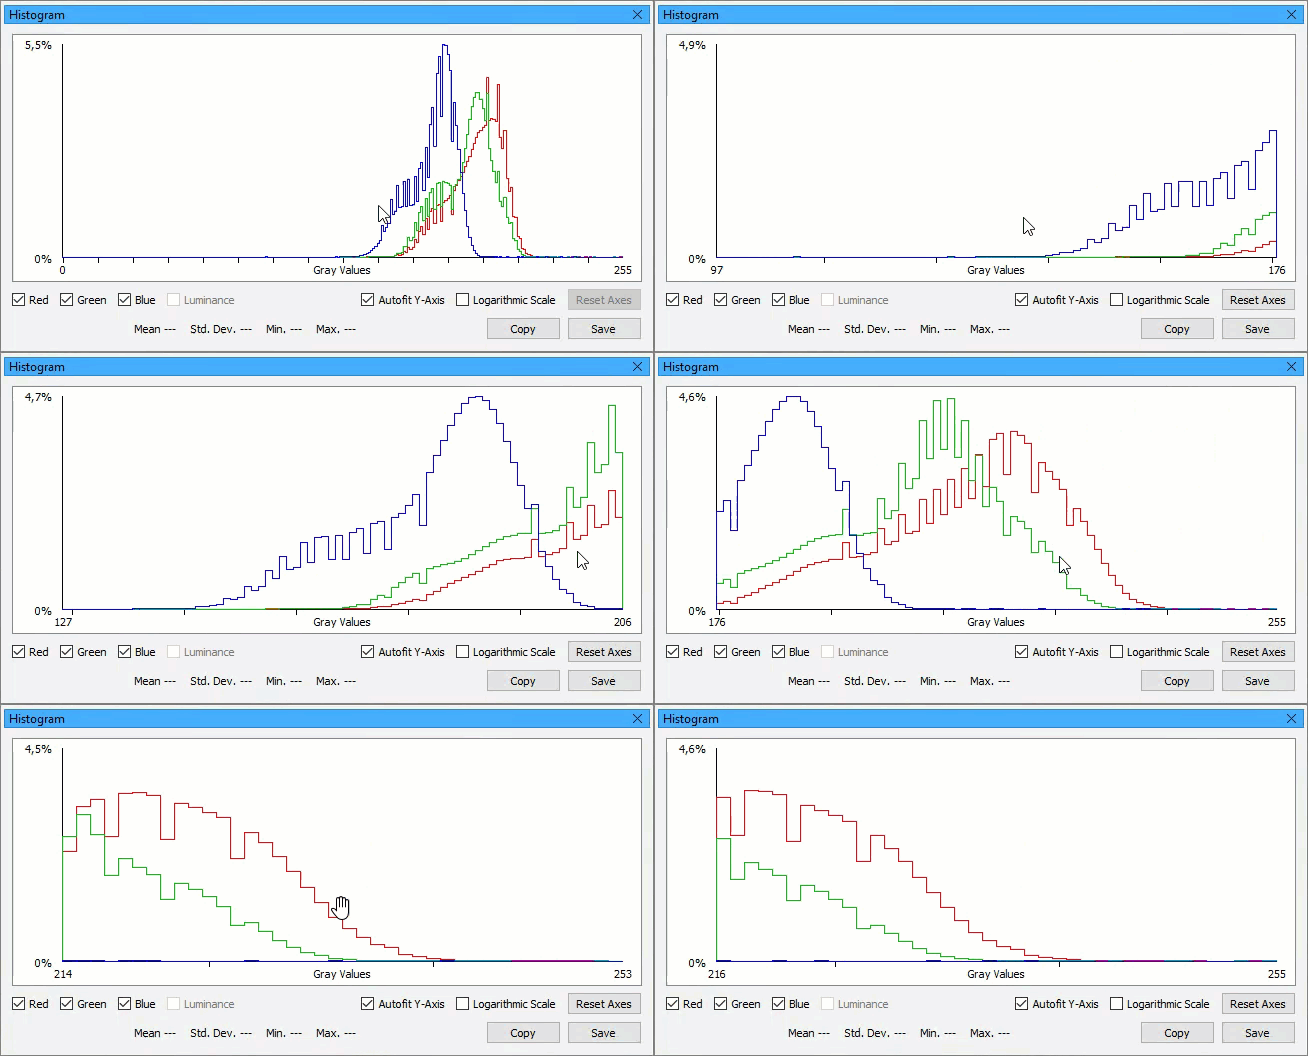
Panning and zooming allows you to look at specific areas of the histogram(s) in more detail.
To zoom in or out, hold down the Ctrl (Cmd) key and scroll the mouse wheel while the mouse pointer is over a histogram.
When zoomed in, you can click and hold the left mouse button to pan.

To reset the zoom level, click Reset Axes.